Thursday, June 5, 2014

Experiment 13: Bandwidth and Signal Analysis

Introduction:
     This lab observes the phenomenon of how circuits can be modified to resonate within a desired frequency and bandwidth. We start by solving for theoretical values on a circuit resembling a tuner for a car radio, (a simple RLC circuit).
 - Solve for theoretical bandwidth.
-  Obtain actual bandwidth from experimentation.

Once we set up the series RLC circuit connected to a signal generator, we performed theoretical calculations and then solved for the actual bandwidth.


Our Circuit Diagram And actual circuit:
The RLC circuit with a 10 Ohm Resistor and a 1 microFarad Capacitor.


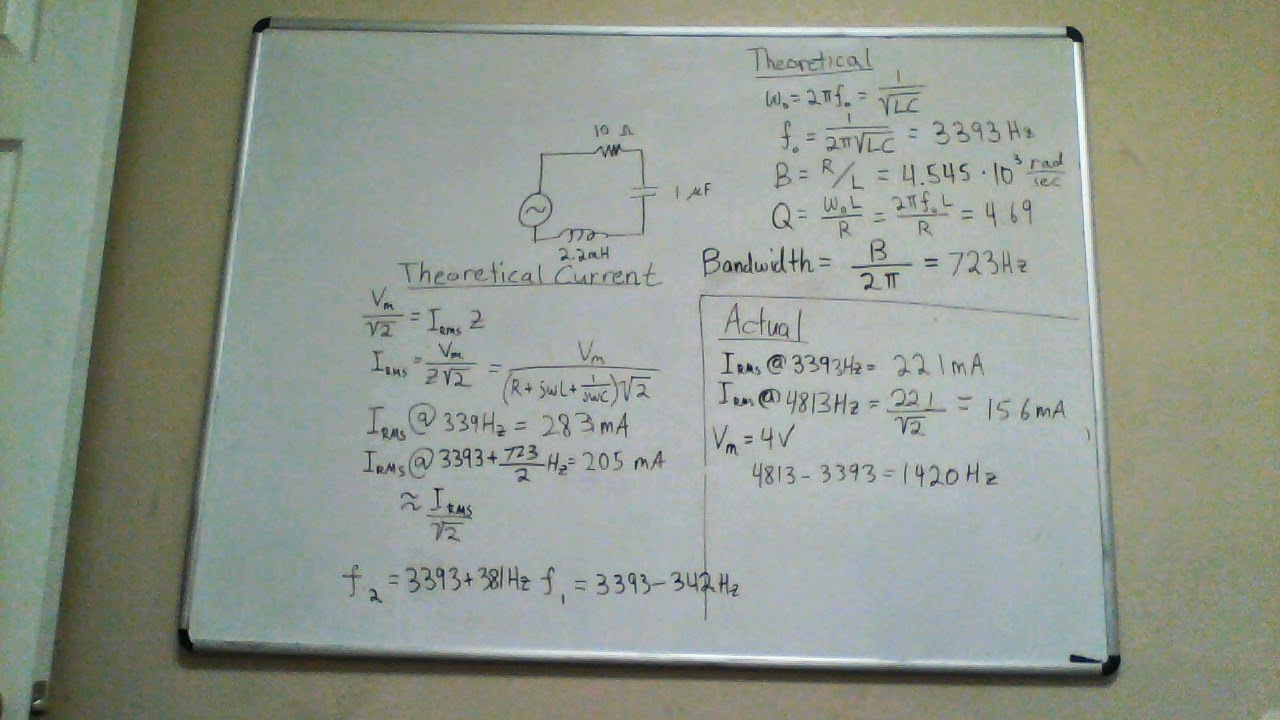
The resonant frequency was found to be large due to smaller values in capacitance and inductance. The Bandwidth was found to be 723 Hz theoretically and the bandwith threshold between 3393 - 342 Hz and 3393 + 381 Hz.

(1423-723)/723 * 100 = 96.818% Error.


The RLC circuit with a 100 Ohm Resistor and a 100 microFarad Capacitor.


This circuit's resonant frequency was found to be lesser than the previous circuit. The bandwidth was found to be 7230 Hz theoretically and the bandwidth threshold between 339 - 323 Hz, 339 + 6910 Hz.


(8070 - 7230)/7230 * 100 = 11.61% Error


We hooked up an Ammeter to measure the passing current and increased the frequency until the current decreased by 1/root2, which was the value of current for half power.

The actual value  were off by a significant amount, which was probably due to non-ideal resistance of the capacitor and the inductor factoring into the real value of power. The first RLC circuit was affected heavily due to it originally having a small value of resistance.

Conclusion:
      This lab gives us a decent understanding of how frequency-dependent circuits may be modified to obtain measurements of bandwidth.


Experiment 12: Frequency Response and Filters

Introduction:
     In electrical engineering, signal modification is a crucial component to many solutions to real world problems. In this experiment, we will be working with high pass and pow pass analog filters to form a deeper understanding on how frequencies are amplified or reduced. There will also be data and error analysis.


List of Materials

Capacitor box set to 0.1 micro Farad, 1000 Ω resistor, Frequency generator, DMM, leads.

First, we calculated the theoretical gain of the low pass filter frequency response for variable values of frequency. We then set up the circuit accordingly to this diagram.
Low Pass Filter Frequency Response Set up


Finally the circuit.
That Keyboard Doe
Here's our result

We move onto the next step in the experiment: High pass filter frequency response: simply measure across the resistor instead.


Actual results of the high pass frequency filter circuit

Finally, we use excel to graph our function., the input RMS voltage from the function generator was 5V. In order to calculate gain, we took the voltage obtained through the measurements and divided by 5V rms. The Y axis is the experiment's gain and the X axis is the frequency.


As we can see, the high pass frequency filter tops off at around 2000-3000 Hz, which is probably the natural frequency of the circuit.


For the low pass frequency filter, it is obviously shown in this graph that low frequencies around 10-100 hz aren't affected while the higher frequencies drop off.

NOTE: one observation we noted during the lab is that as the frequency increased, the Vin had to be slightly increased in order to maintain a steady Vrms. 

Conclusion
This lab demonstrated how certain frequencies with certain circuit elements can allow voltage through specific frequencies, and block all others. This is particularly useful if you are trying to broadcast/receive a signal at a specific frequency. Our largest margin of error was around 2.5%, which is indeed supah hawt and secksy.